Understanding Wallet Intelligence Metrics For NFT Analysis
Discover how Thirdwave analyzes NFT community health through comprehensive on-chain metrics. Learn what each metric means and how it contributes to understanding community strength.


What is Wallet Intelligence?
Wallet Intelligence is Thirdwave's comprehensive framework for evaluating NFT community health and engagement through on-chain data analysis. By examining multiple aspects of wallet behavior, transaction patterns, and holding trends, these metrics provide deep insights into community strength and project sustainability.
During analysis, our system examines various behavioral patterns, from initial minting activity to long-term holding patterns. This helps projects and investors understand community dynamics and make informed decisions based on actual on-chain behavior rather than speculation.
Regular monitoring of these metrics helps projects track community health, identify areas for improvement, and benchmark against other successful projects in the space.
Understanding Key Metrics
Minter Retention
Minter Retention measures the percentage of original minting wallets that continue to hold their NFTs. This metric is crucial for understanding community loyalty and initial holder conviction.
High minter retention often indicates:
- Strong community belief in the project
- Effective value delivery to holders
- Healthy long-term growth potential
Median Wallet Value
The Median Wallet Value metric calculates the median USD value across all wallets holding a project's NFTs. You can think of it as the net worth of the holders of a particular NFT collection. This includes both native tokens and ERC20 holdings, providing insight into the community's financial capacity.
This metric helps understand:
- Holder spend capability
- Holder financial stability
- Project's ability to attract substantial investors
HODLer Score
The HODLer Score (0-100) analyzes wallet behavior to predict holding patterns. It examines factors like:
- Average holding duration
- Trading frequency
- Portfolio diversification patterns
A higher score suggests a community more likely to hold long-term, while lower scores might indicate more active trading behavior. Keep in mind that a score of 50 indicates no prior trading behavior. These scores can shed light on wallets that are more likely to have a positive or negative impact on the floor price of a token.
Engagement Score
The Engagement Score measures community activity levels through various on-chain actions. This 0-100 rating considers:
- Transaction frequency
- Interaction with project contracts
- Trading activity
- Wallet activity patterns
High engagement scores reflect active, participating communities, while lower scores might signal potential inactivity risks.
WaveRank (Quality Score)
WaveRank is Thirdwave's comprehensive quality score, combining multiple factors to assess overall project strength. This score evaluates:
- Wallet Age
- Transaction Consistency
- Spending Patterns
- Engagement Signals
Interpreting and applying WaveRank requires you to understand the scoring distribution. WaveRank values follow a rarity curve, where higher scores represent significantly more active and valuable participants. The average score is 20, with a median of 17. Wallets that score less than 20 represent speculative or disengaged onchain activity. Whereas wallets that score 20-49 encompass moderately active wallets with growth potential. Rare wallets that consistently demonstrate strong engagement and financial contributions, representing the top 2% of users, score 50-79. Lastly, wallets that score 80-100 represent the 0.1% - these wallets are the ecosystem’s most elite participants.
The Importance of Metric Analysis
Understanding these metrics is crucial for:
Project Teams:
- Identifying community onchain strengths and weaknesses
- Making data-driven development decisions
- Evaluating potential partner and growth channel quality alignment
Investors:
- Evaluating project health
- Comparing projects objectively
- Making informed investment decisions
Community Members:
- Understanding community member dynamics
- Gauging community strength
- Making informed holding decisions
Best Practices for Using Metrics
Holistic Analysis
While individual metrics provide valuable insights, they should be considered together for a complete picture of community health. No single metric tells the whole story.
Trend Analysis
Track metrics over time to identify patterns and trends. Short-term fluctuations are less important than long-term trajectories.
Comparative Context
Compare metrics across similar projects while considering project age, size, and market conditions for meaningful insights.
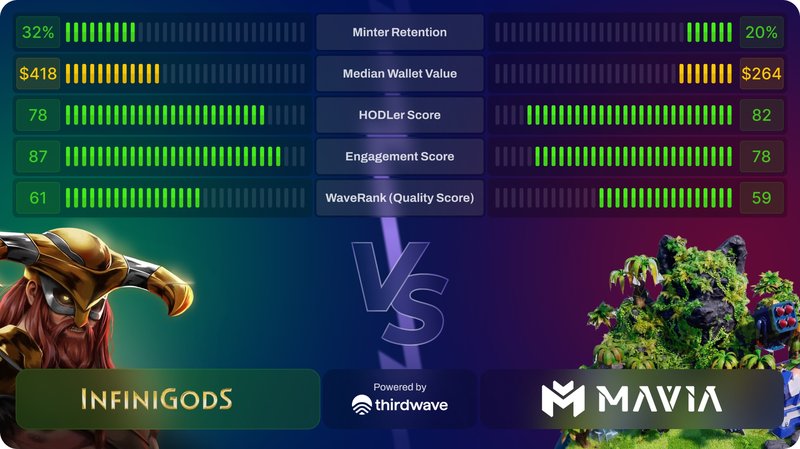
Metrics in Action: Weekly Head to Head Match Ups

Thirdwave's Weekly Head to Head Match Ups showcase these metrics in action, providing real-time analysis of top NFT gaming communities. Each week, we pit two prominent projects against each other, examining their community health through our Wallet Intelligence framework.
These matchups offer:
- Direct comparative analysis of community metrics
- Real-world examples of metric interpretation
- Insights into different community building strategies
- Transparent, data-driven project evaluation
Follow our weekly battles on Twitter (@thirdwavelabs) to see how different communities stack up across these crucial metrics. These comparisons not only highlight project strengths but also demonstrate how different communities can excel in various aspects of on-chain engagement and holder behavior.
Conclusion
Wallet Intelligence metrics provide powerful tools for understanding NFT community health and project potential. By analyzing these metrics thoughtfully and in context, stakeholders can make more informed decisions and better understand community dynamics.
Regular monitoring and analysis of these metrics help ensure project teams, investors, and community members have the insights they need to participate effectively in the NFT ecosystem.
Author

